How Walkable is Charlotte Park in Nashville, TN?
Charlotte Park carries a Walk Score of 32, placing this west Nashville neighborhood in the "Car-Dependent" category. Charlotte Park near Nashville, TN requires a car for most daily errands despite its relatively central location. The area has seen active residential development with mid-century homes attracting renovation and new construction.
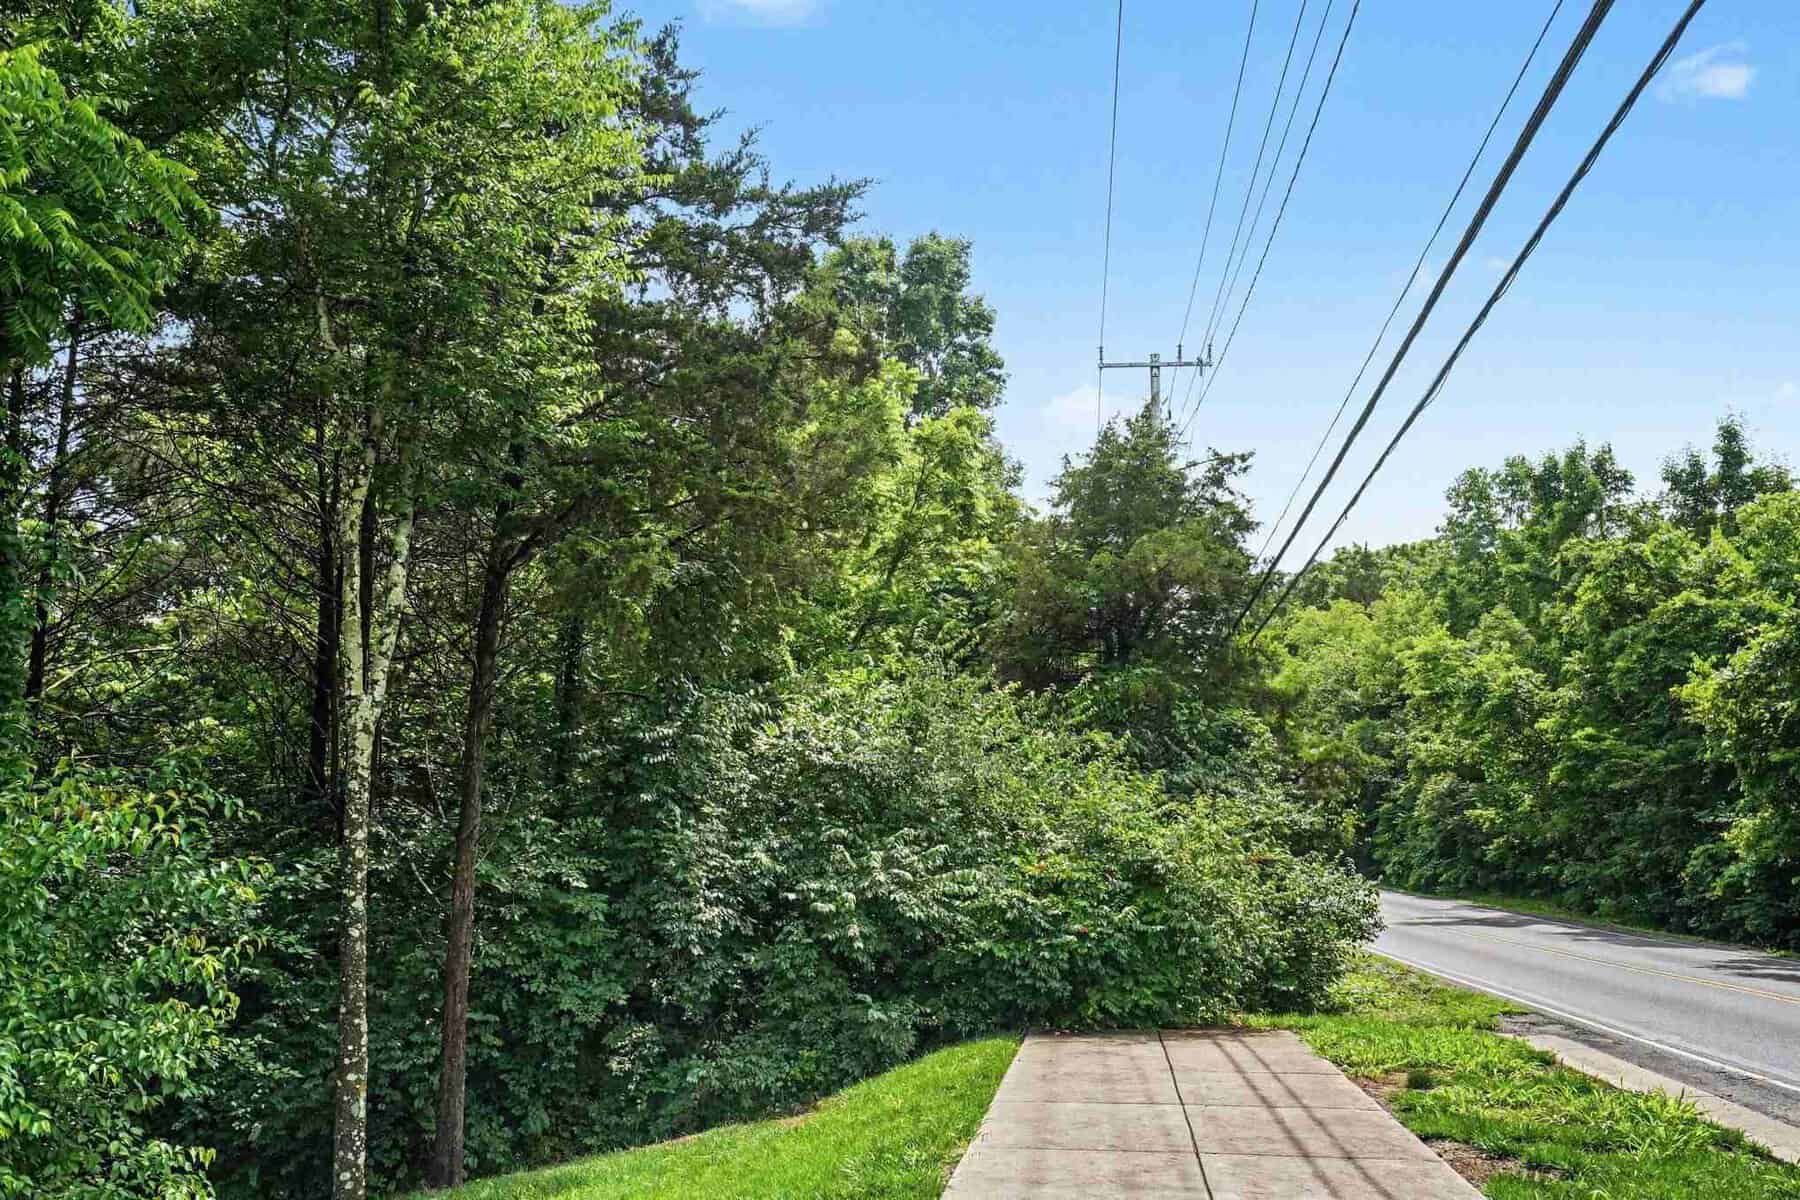
Walkability in the Nashville area
Charlotte Park's 32 is close to the Nashville metro average of 29. It scores below nearby Sylvan Park (51) and Hillsboro-West End (65) but similarly to Green Hills (30) and Inglewood (35).
Charlotte Pike, the neighborhood's main corridor, is a wide arterial designed for cars rather than pedestrians. While commercial destinations exist along the pike, the distances and road design make walking impractical. The area lacks the connected street grid that gives East Nashville its higher scores.
What a Walk Score of 32 means
Charlotte Park's Walk Score of 32 puts it in the "Car-Dependent" tier. Residents drive for groceries, dining, and most services. The bike score of 25 (Minimal Bike Infrastructure) and transit score of 25 (Some Transit) confirm that alternatives to driving are limited. Charlotte Pike lacks bike lanes, and bus service runs infrequently.
Why do buyers choose Charlotte Park?
Charlotte Park attracts buyers willing to trade walkability for value within Davidson County. The median sale price of $701,760 is essentially flat year over year. About 22% of homes sell above asking with homes spending 79 days on market. That's a slower pace than the walkable East Nashville neighborhoods, but stronger competition than the suburban cities where prices are much lower.
At $701,760, Charlotte Park costs less than Sylvan Park ($1,099,625) next door despite a similar distance to downtown. The 19-point Walk Score gap between the two largely explains the price difference. Buyers here prioritize house size and lot space over pedestrian convenience, accepting a car-oriented lifestyle at a city address.
| City/Neighborhood | Walk Score | Bike Score | Transit Score | Median Price | Days on Market |
|---|---|---|---|---|---|
| Charlotte Park ★ | 32 | 25 | 25 | $701,760 | 79 days |
| Green Hills | 30 | 30 | 23 | $1,299,556 | 68 days |
| Inglewood | 35 | 37 | 33 | $499,729 | 43 days |
| Woodbine | 46 | 31 | 33 | $404,862 | 54 days |
| Shelby Hills | 49 | 44 | 33 | $824,719 | 51 days |
| Salemtown | 50 | 62 | 39 | $764,739 | 64 days |
Limited to neighborhoods with at least 10 home sales in the period.
All data comes from Redfin and represents a three-month rolling average ending July 2026. This article has been generated, in whole or in part, using generative artificial intelligence (AI) technology, with input from Redfin head of economics research Chen Zhao. While efforts have been made to ensure the accuracy and reliability of this information, you should independently verify all data, facts, and citations contained in this article before relying on it for any purpose. This information is not a substitute for advice from a real estate agent, financial advisor, or other licensed professional. Check the Redfin Data Center for additional in-depth housing market data.
Categories
Recent Posts